Campaign dashboard
This dashboard allows users to get information about what's going on in their chat campaigns in a simple visual way.
This section contains of 4 different graphical reports: Chats (Chats), Success codes (Resultaatcodes), Duration (Gespreksduur) and Utilization (Utilisation).
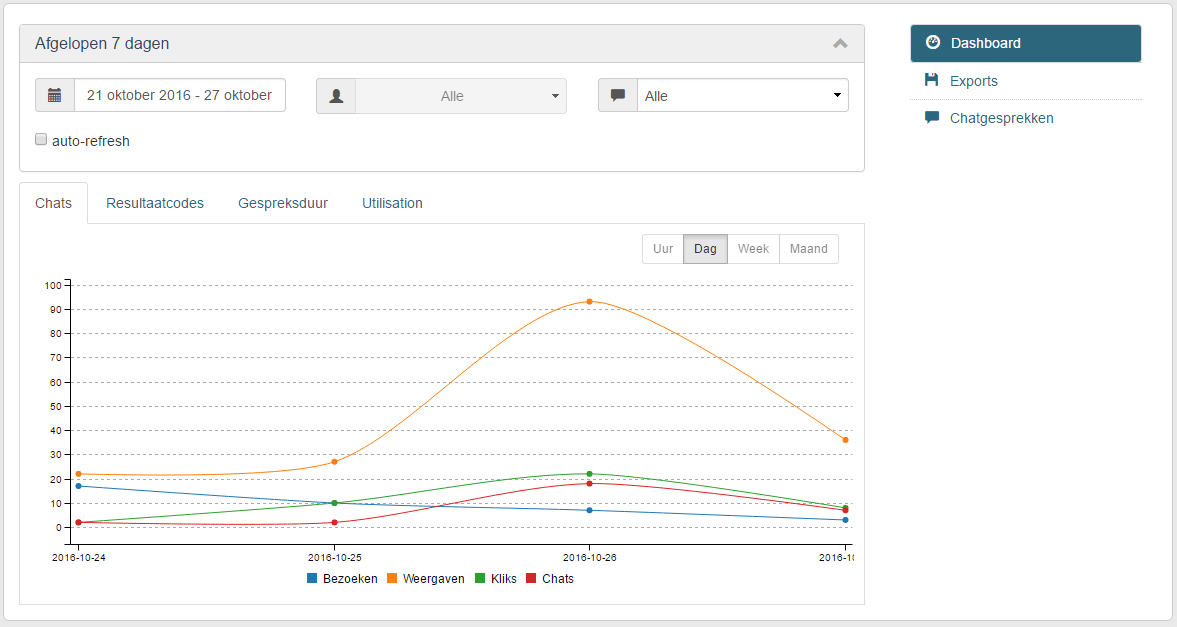
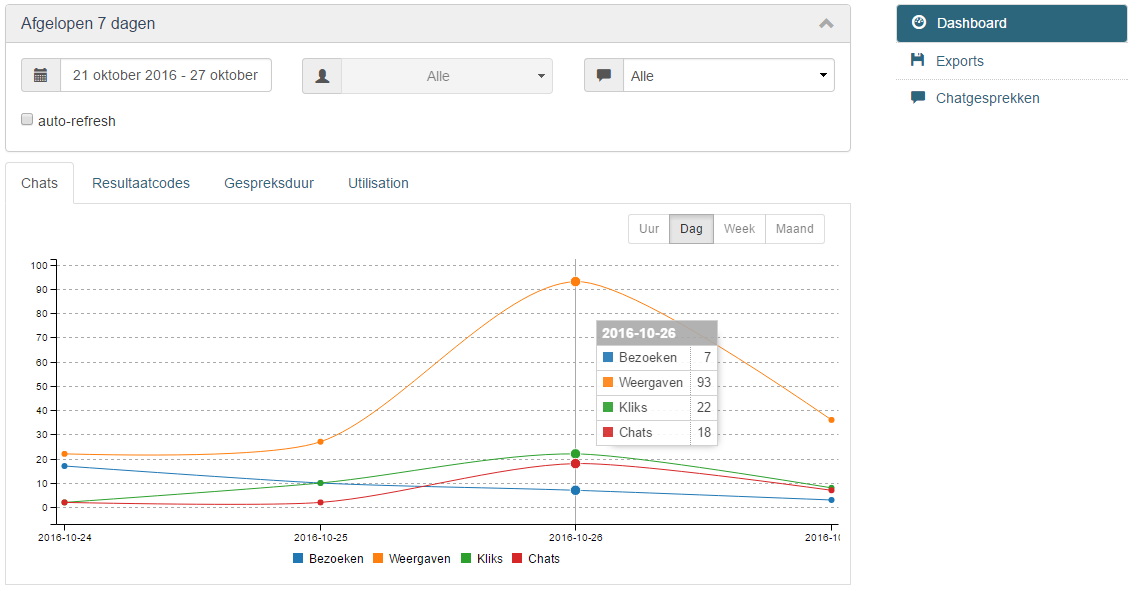
Those reports display the information generated by your chat campaign and you can always hover the charts to get more information in a floating tooltip menu.
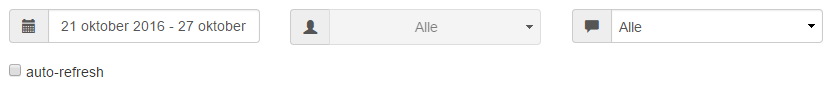
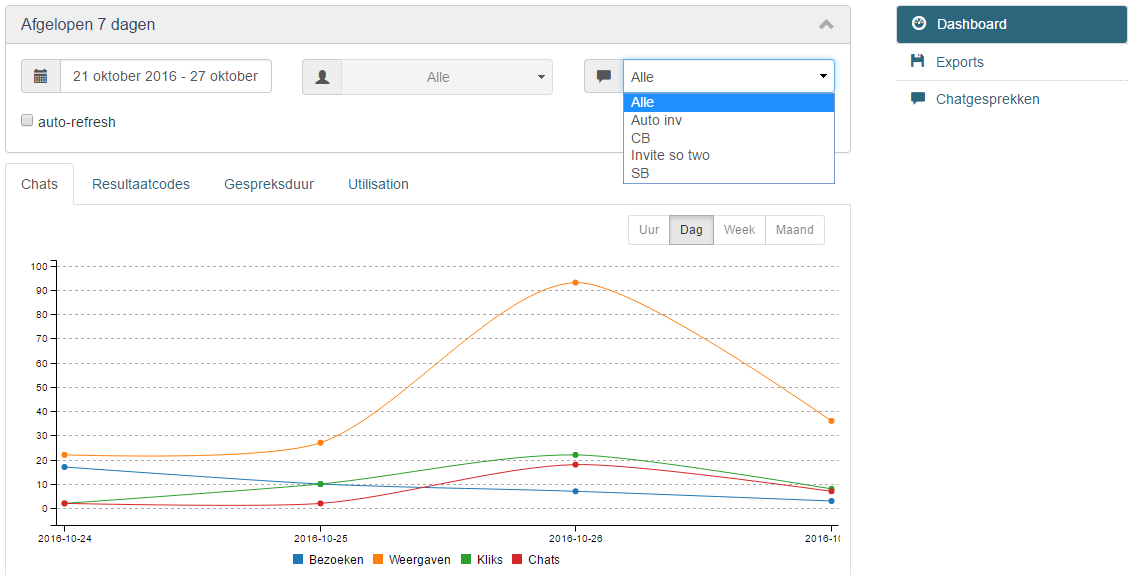
This section also includes a filter panel which allows you to filter the information you're seeing in the graphical reports, you can filter by date, users or entrypoint type (invites or chat buttons).
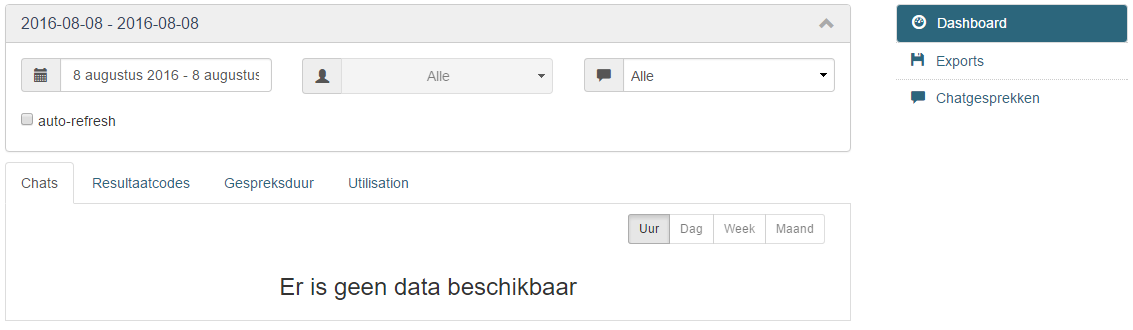
If you select some date period to filter by and there's no data in the system to generate the charts, then you'll see this message "There's no data to display" ("Er is geen data beschikbaar").
Also you can get live data if you check the "Auto-refresh" checkbox. We'll talk later about the Auto-refresh functionality.
Chats
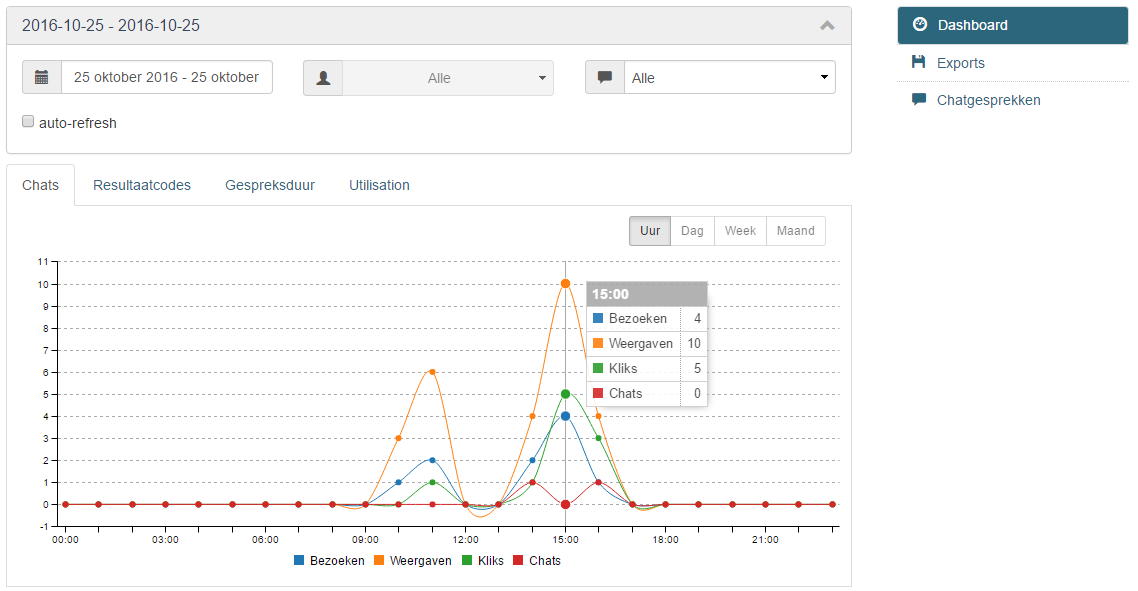
The chat report visualizes information on: Visits (Bezoeken), Views (Weergaven), Clicks (Kliks), Chats (Chats). The displayed data relates to the selected Campaign.
- Views (Weergaven) - is the number of displays on different pages on the website for a visitor over all campaigns;
- Visits (Bezoeken) - is the number of visitors. It increases after every new user visiting the website or for visitors who's session was expired; so it is not related with the chat campaign in particular;
- Clicks (Kliks) - is the number of times the visitor clicked the chat button or invite to start a chat;
- Chats (Chats) - is the number of started chats.
All available data can be displayed according to the selected time period. All available options include filtering by Data and Enrtypoint. These options may filter search information separately or collectively. The users filter is disabled for this report.
Also the live data checkbox is present on the page. This is a special functionality that allows you to get realtime data for your charts. When auto-refresh is enabled, the date filter will be disabled and you'll see only real time date for "Today" in your charts. The charts will be regenerated every 30 seconds displaying information about what's happening on your chat campaign from today at 00:00 until the current hour.
A standard system list of time periods is an easy way to find data using default time requirements such as: Today (Vandaag), Yesterday (Gisteren), Last 7 days (Afgelopen 7 dagen), Last 30 days (Afgelopen 30 dagen), This week (Deze week), This month (Deze Maand), Last month (Afgelopen Maand), Otherwise (Anders)
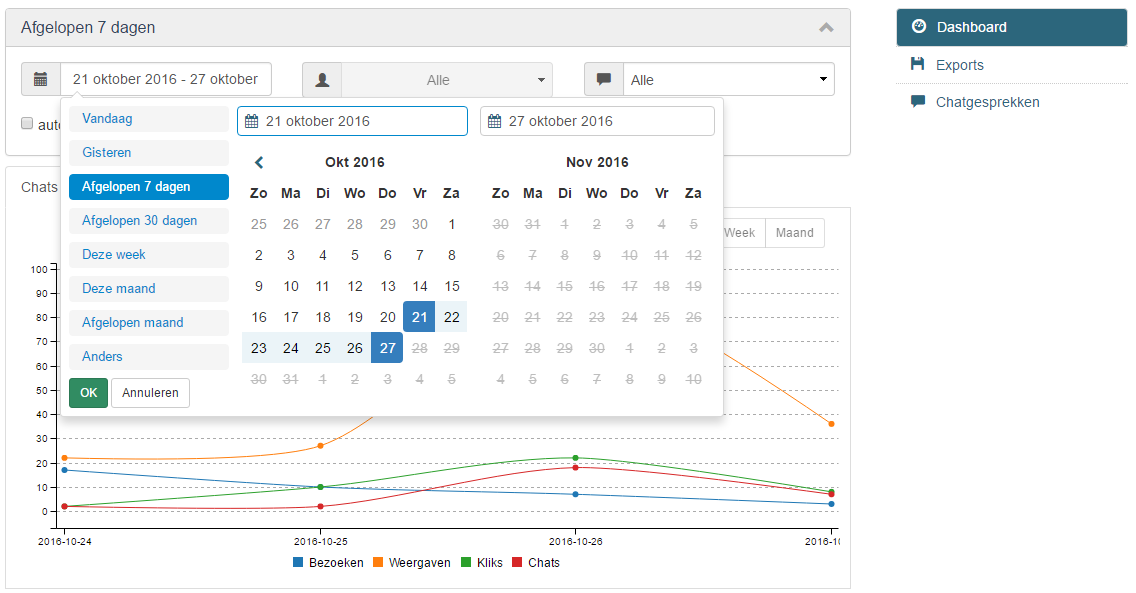
Click the entry points dropdown expands filtering by Invite or Button. So the user is able to sort selected time period also by the way of opening the chat (Invites, Chat buttons). Deleted entrypoint invite/button that were active and generated ‘history' (‘history' is what the dashboard and csv’s show) should be shown in the dropdown also.
Also the chat subfilter is present on page. It helps to review more detail information for the selected time period. It consists of: Hour (Uur), Day (Dag), Week (Week) and Month (Maand).
These time periods are easy to find on the graphical line segment. They reflect number of Visits (Bezoeken), Views (Weergaven), Clicks (Kliks), Chats (Chats) for the selected time segment.
There are rules for the subfilters that are available:
1) When the difference between start date and end date is less than two days - 'hour/uur' tab is enabled;
2) When the difference between start date and end date is between 1 and 10 days - 'day' tab is enabled;
3) When the difference between start date and end date is between 14 and 160 days - 'week' tab is enabled;
4) When the difference between start date and end date is more than 62 days -'month' tab is enabled.
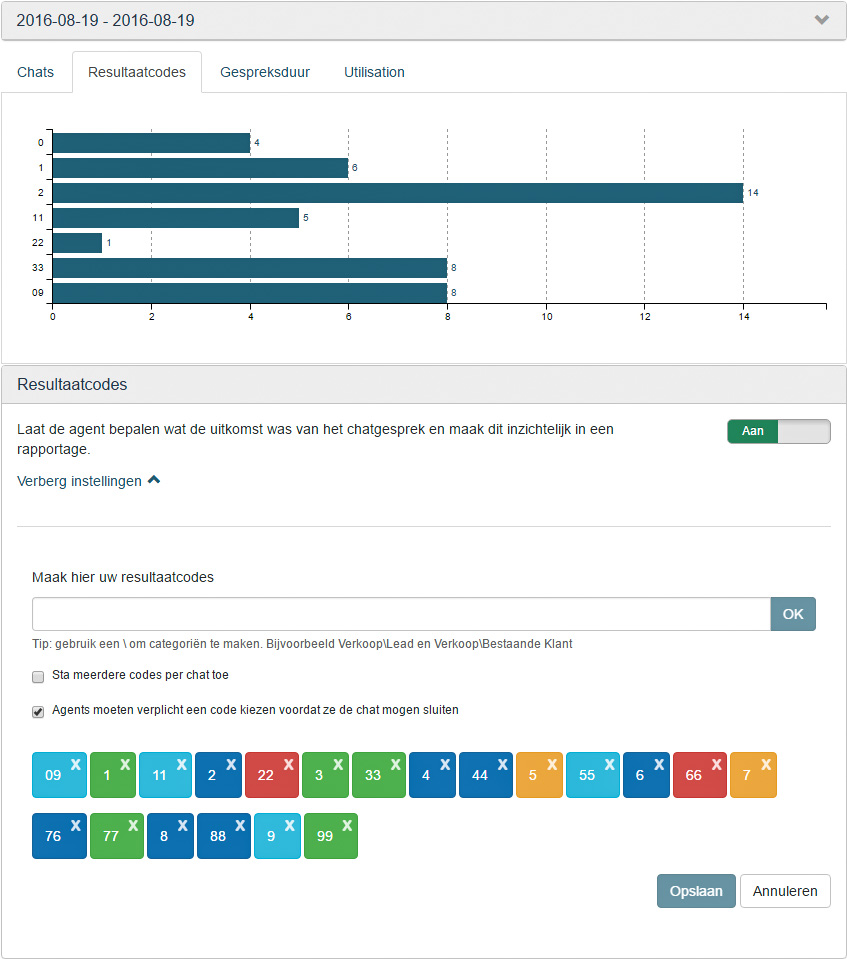
Success codes
The manager will be able to follow the most frequent subjects of request in accordance with the result of the use codes.
The success code report row is generated when operator/visitor both close the conversation. To see newly created code, the user has to apply it to a conversation and the conversation has to be closed. If the user does not do this, the data will not be shown on the graphical report.
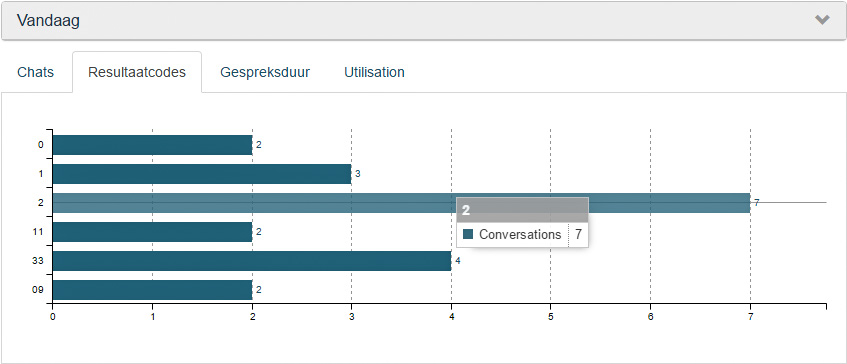
The graph displays all success codes that have been chosen by users during (or after) a conversation with the visitor. It displays the success code name in the left side of the chart and also the number of conversations. All success codes are grouped and the user will be able to see the count by hovering the mouse on the success code on a chart.
Even if user deleted a success code that was used in the past it will still be displayed. This is historical data.
Duration
The duration report displays different and important information on the users total work and performance.
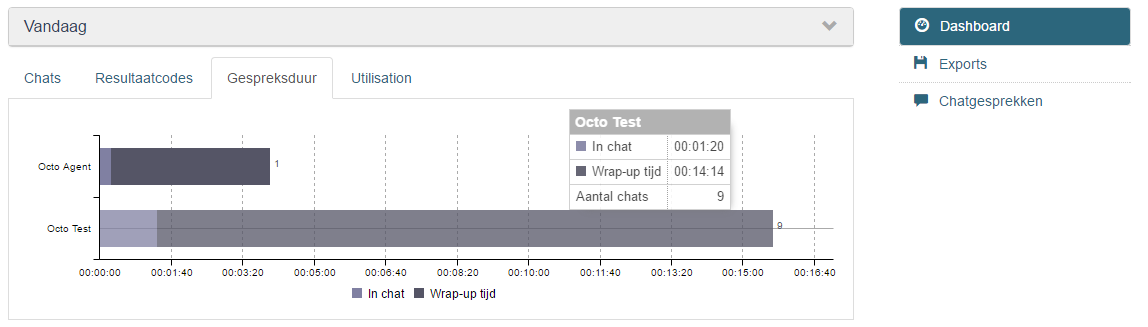
In Chat (In Chat): the time the user was chatting with your visitors. Timestamp first message until timestamp last message. The time from first to the last message in the chat. No time records if there is only 1 message in the chat.
The current workflow:
- "In chat" value is calculated in case there was a cobrowsing screen sharing activity but was no message.
- "In-chat" time is calculated to the latest Operator who has received the forwarded chat.
After Chat (Wrap-up tijd): is the time between the visitor`s last message and the user keeps it opened doing after chat work. The forwarded but not closed chat time should not be counted to the agent Wrap-up value, because as soon as agent clicks forward the conversation is already in the other agent. Timestamp last message + timestamp chatwindow closed (agent side).
The current workflow:
- "Wrap-up" value is calculated form the last visitor message until agent close chat, so if Operator logs out and comes back this time (Agent was out of the system) is count.
- "Wrap-up" value is calculated in case there was a cobrowsing screensharing activity but was no message
It also displays the number of conversations for a user.
Utilization
The Utilization reports show statistics about the user utilization rates: The time when a logged in user was online and offline.
This report also gives more information when you hover on users in the chart, displaying the Total (Totaal) number of conversations, how many of those conversations were Proactive (Proactief) 'Invites' or Reactive (Reactief) 'Chat buttons' and the Ratio of conversations per hour.
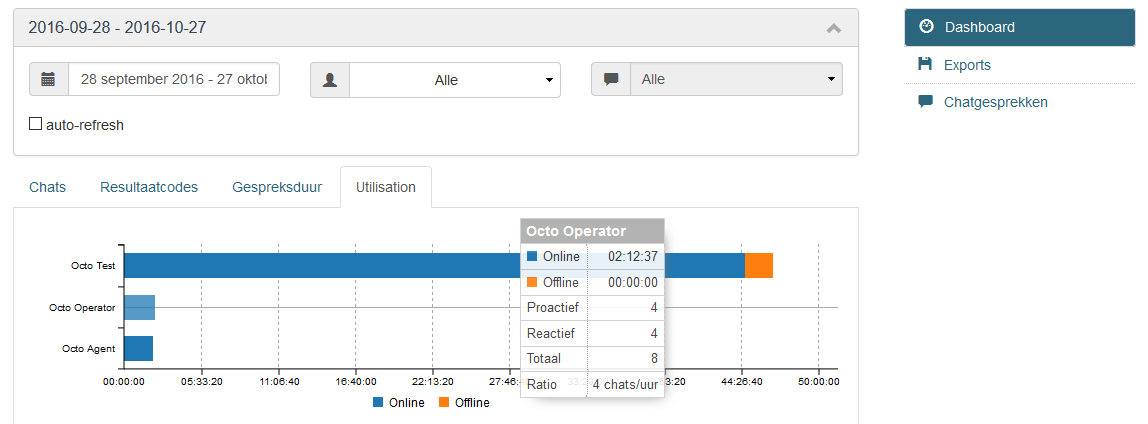
The auto-refresh for Utilization report is available but you have to be aware that the system data for this report is only generating just after the user logs out or changes his/her availability. In that moment the system calculates for how long the user was online or offline and produces the data for the report. If those events are not generated in the system then you won't see any real time data on this report.
Comments
0 comments
Article is closed for comments.